
11 November 2022
By: Brooke Andel and Spencer Harstad
As we were beginning the end of our time working in the lab, we finished all the qPCRs we needed to have to be able to analyze our results. Over the past few weeks, we wrapped up calculating the values needed to perform a statistical analysis using the excel spreadsheet document provided by Dr. Cohen. Then, we had the chance to find out the results of the questions we have been working to answer all semester long about if CIRBP and HUNK are regulated differently across seasons and sexes in green anole lizards.
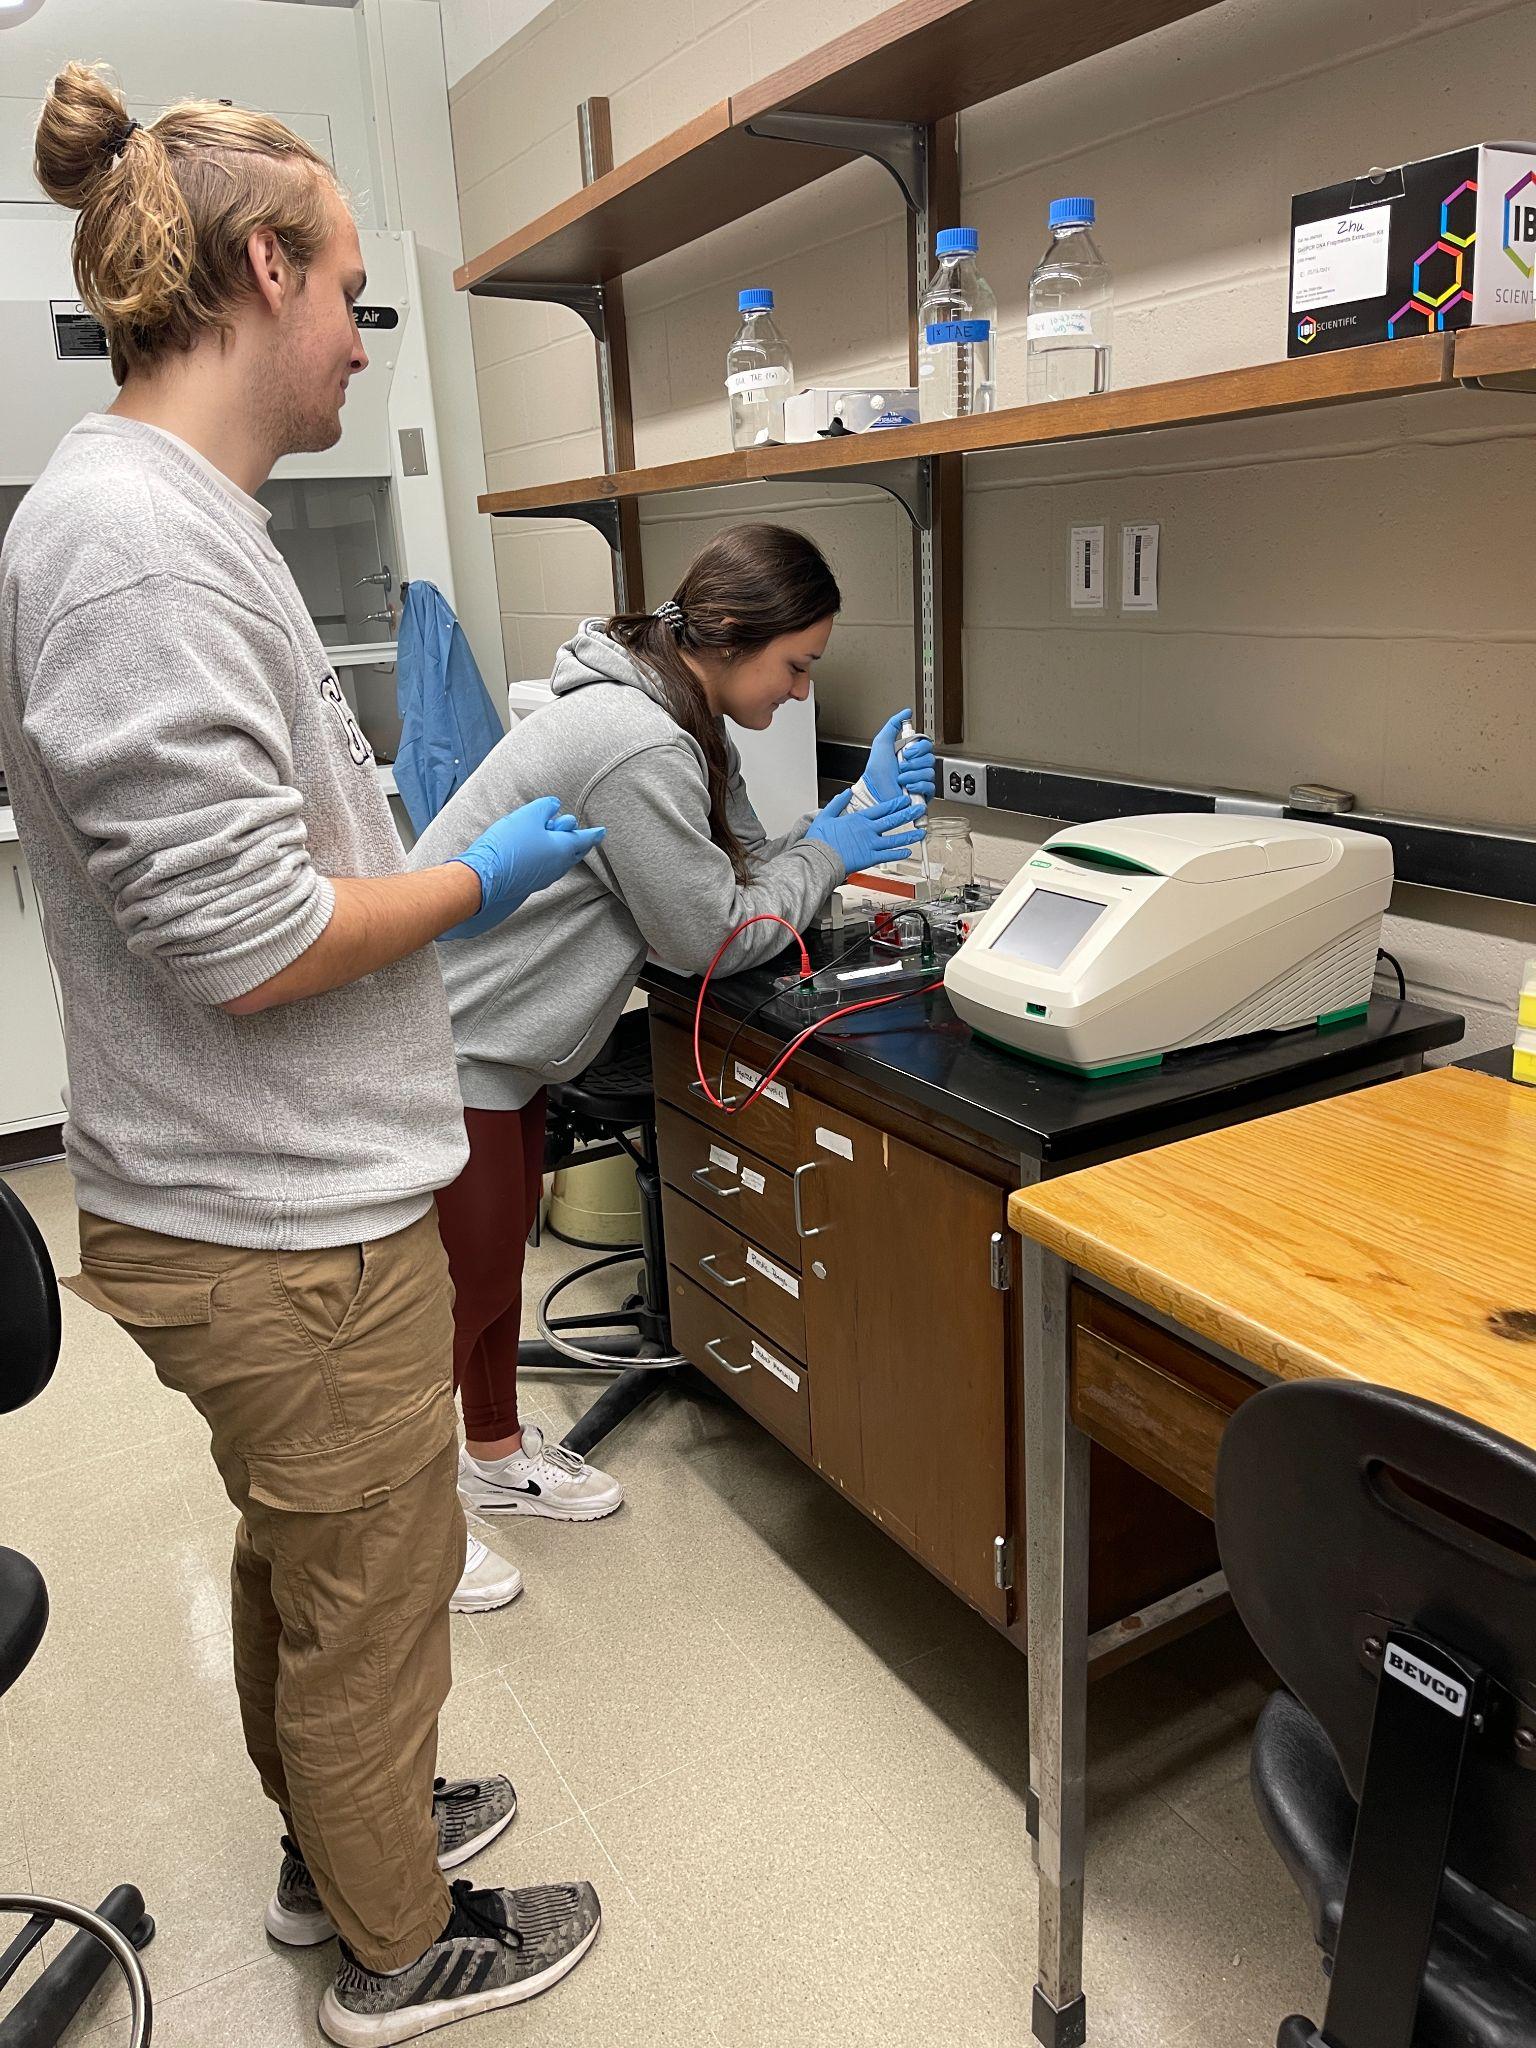
Research: Over the last few weeks we successfully completed the full run qPCRs for HUNK, CIRBP, and beta-actin in order to determine the roles CIRBP and HUNK have in the differences seen in green anole lizards between sex and season. After using the equations and values from our standard curves, to evaluate the efficiency values of all our full runs for HUNK and CIRBP we had good efficiency values that gave us the ability to run statistical analysis. We also made sure that for some of the samples that showed to have multiple peaks on the melt curve graph in our full run. qPCR for HUNK, CIRBP, and beta-actin, we checked these samples through using gel electrophoresis to ensure we had normal amplification within these samples. Before performing the analysis using computer software, we made sure to complete the calculations through the provided equations in order to decode the cDNA samples with what animal they were from. So, this allowed us to know the sex and season of each cDNA sample that we created earlier in the semester.
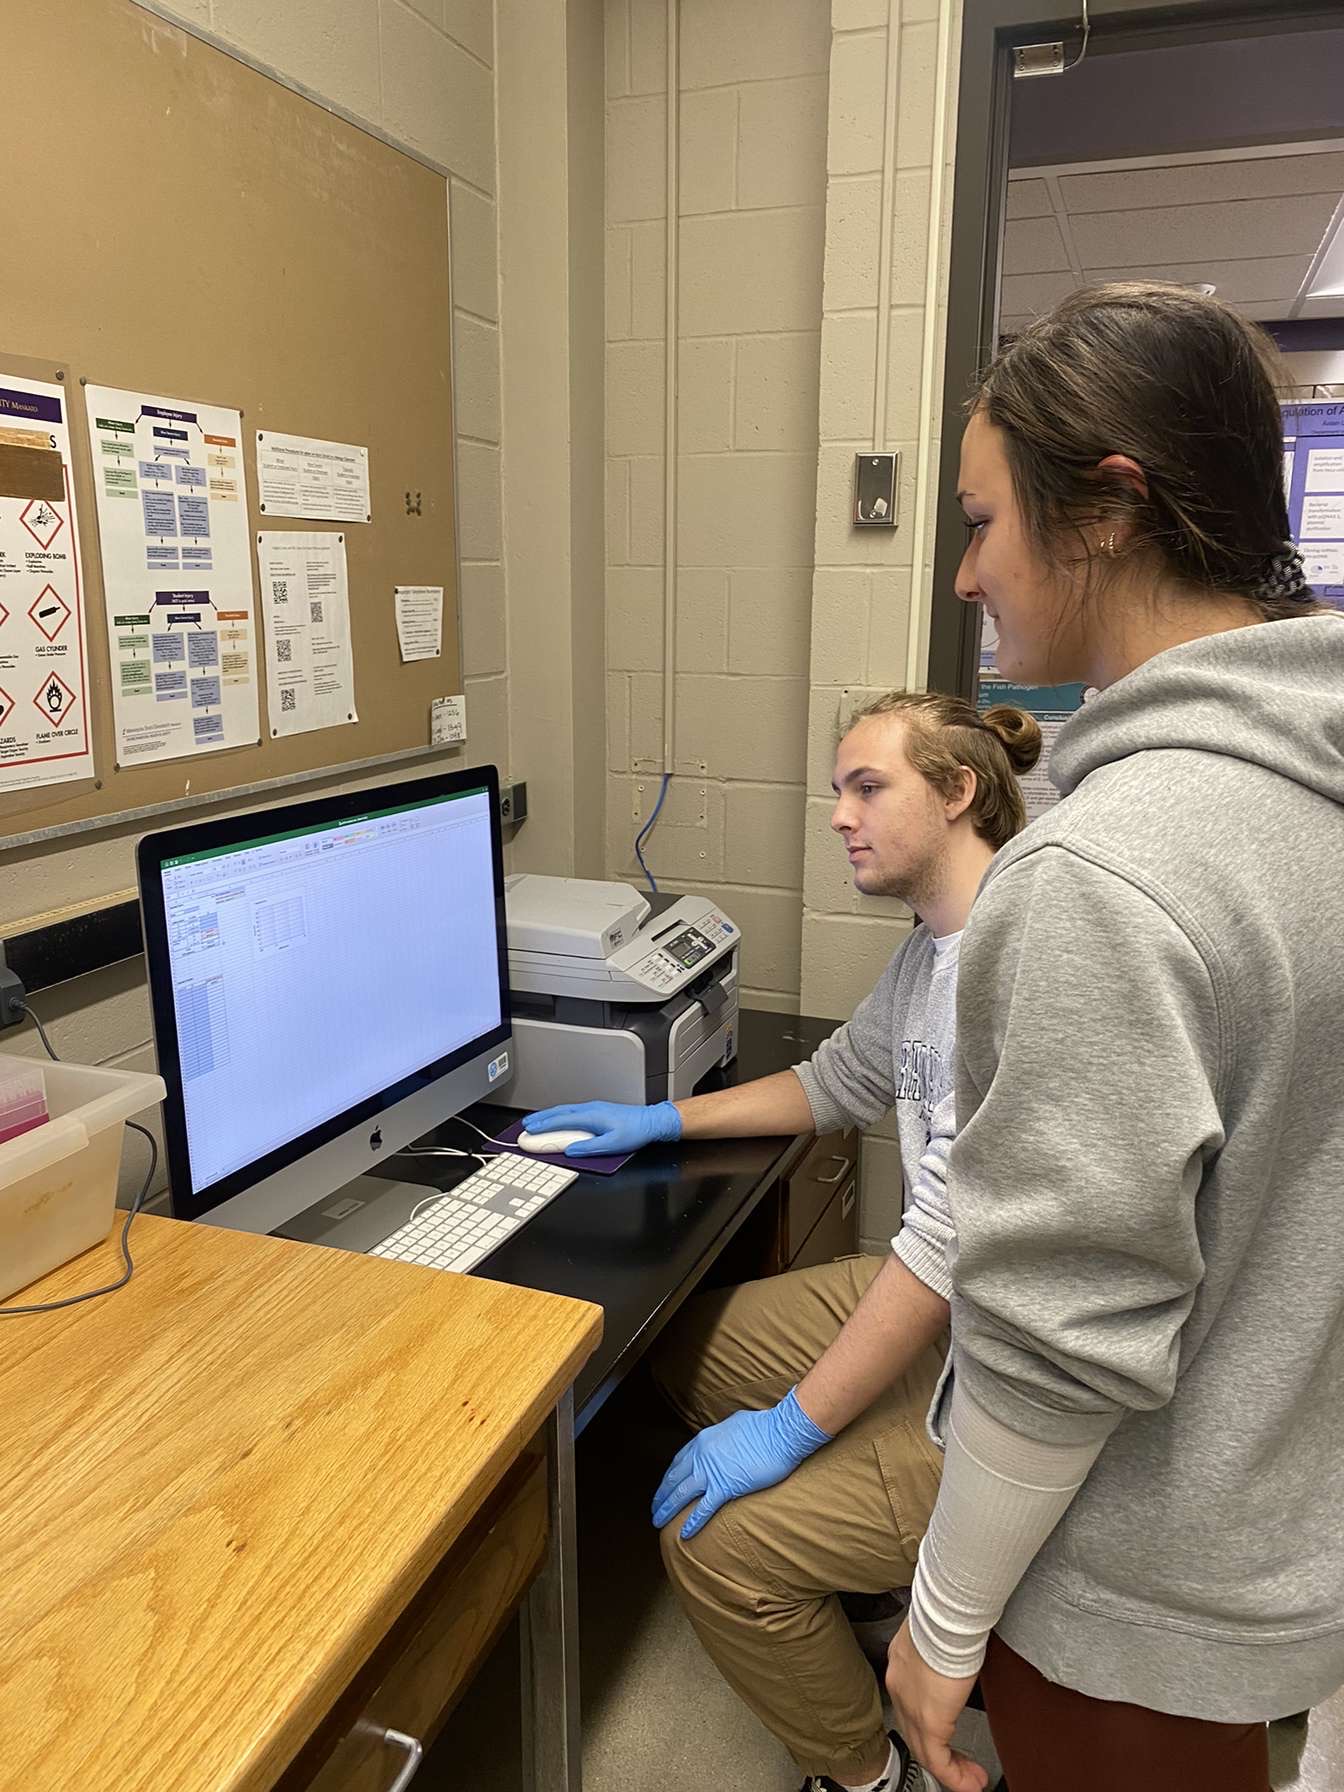
We inserted the data into the computer software SPSS, which would allow us to statistically analyze our results. Since we were testing more than two groups, we used an ANOVA that allows us to determine if there is a difference between the means of more than two groups. Since we have 2 variables of sex and seasons, we had 4 groups, breeding males and females and nonbreeding males and females. When using this method to analyze our data we were checking for a statistical difference for both genes. The results of our statistical analysis were that for both HUNK and CIRBP there is no significant difference between sex and seasons in green anole lizards. After we were able to gather the results for our genes, we began the process of creating our poster for the end-of-the-semester poster presentation with all the RISEbio scholars. To make a strong and eye-appealing poster it is important to create a layout that allows a viewer to follow along and understand the processes that we have worked through. On our poster, we are working to include figures and images that help the audience visualize the process and results we have gathered throughout this experience. Posters are important to science because they convey science in a way that is efficient and helps the reader understand what they are reading. When incorporating figures, for viewers who will not be at the presentation these will suffice to explain the work we have done and the results we have found. Once we submit our first draft, Dr. Cohen, our professor, will review our first draft and recommend changes to help us improve our poster.
It is hard to believe we are approaching the end of our RISEbio experience; however, we are very proud of how far we have come and how much we have learned throughout the entire process. We look forward to closing out our RISEbio experience and continuing to dive into our curiosity in research. We are extremely grateful and fortunate to have had this experience with guidance from Taylor Grossen (peer mentor), Nick Shankey (graduate assistant), and of course our professor who oversees our research, Dr. Cohen.