By Sarah VanRyswyk and Kylee Hanks
Recently in RISEbio, we have been quantifying proline using a colorimetric assay and practicing making a standard curve via spectrophotometry using a 96-well plate.
Proline is an amino acid that plays a key role in stress response in plants. It can accumulate over time and high levels are an indication of high stress. In our experiment, we used a colorimetric assay with spectrophotometry to determine the proline concentration in several different oak species.
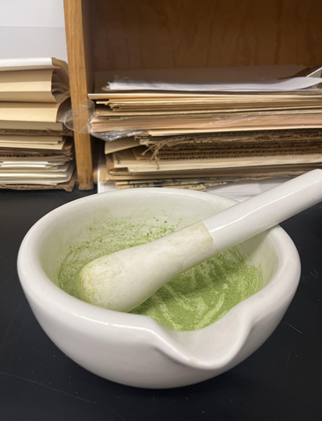
To begin this process, we selected 100 mg of leaf tissue from two different oak species. The species we chose were Q. macrocarpa grown in well-watered conditions and Q. rubra grown in drought conditions. We then proceeded to grind them up into fine powders, removing primary and secondary veins from the powder. Next, we prepared our seven standard solutions (46, 36.8, 27.6, 18.4, 9.2, 4.6, 0 μL/mL).We pipeted the appropriate volume of the standard solution into each of our test tubes and then pipetted the corresponding amount of water into the test tubes as well.
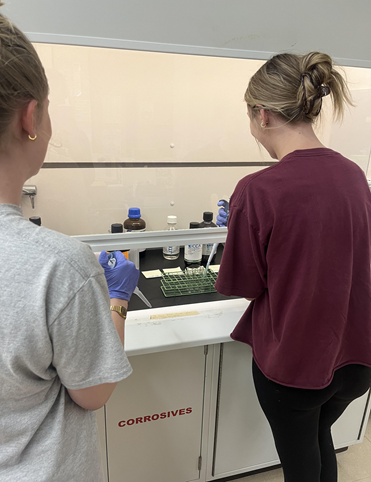
Under the fume hood, we pipette 1000 μl of 3% sulfosalicylic acid to our leaf tissue samples. We then stirred these with a metal needle until the two were completely mixed. Next, the samples were centrifuged for 5 minutes and placed onto ice immediately after. To prepare the test tubes, we added 100ul of 3% sulfosalicylic acid, 200 μl glacial acid acetic acid, and 200 μl of acidic ninhydrin to each test tube including our standards.
After taking our leaf samples from the ice bath, we pipette 100 μL of the supernatant, a liquid that lies above the settled leaf residue in the test tubes, from the top of the tubes into our leaf tissue test tubes that we had prepared. Next we pipette 100 μL of each sample and standard into their appropriate wells.
Finally, we had the well plate read by a spectrophotometer and then analyzed our results. Q. macrocarpa had a proline concentration of 39.12 (μL/mL), while Q. rubra had a proline concentration of 50.13 (μL/mL). It was expected that Q. rubra would have a higher proline concentration, as it is under more stress from being grown in drought conditions. Overall, this project was super interesting and pretty straight forward! From this experience, we learned a new skill of quantifying proline from leaves and how to interpret the concentration values we get. We plan to dedicate our research this semester to comparing proline concentration in various Ozark Oak species, as Dr. Kaproth found 8 species located in the same area. We plan to look at the different species samples and analyze what differences we find in proline concentration, lobe shape, and leaf area.
We are excited to get back to work this semester and begin a new research project!