By Wren Poessnecker and Logan VanGuilder
To begin this semester of research we were introduced to proline quantification. Proline
quantification is the process used to find the amount of the amino acid proline is in a given
sample. Proline in plants acts as an osmolyte and tends to be created while plants are
experiencing abiotic stress. We performed a colorimetric assay to quantify the proline present in two plants.
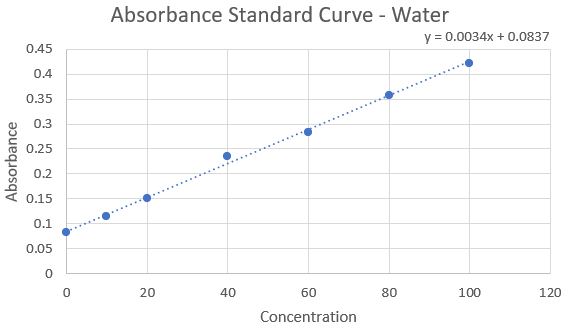
For the first week of protocol, we created a standard curve using distilled water and red
food dye to get used to the process. Later in the week, we spent some time grinding tissue using a mortar and pestle for our two plants to be used as our tissue samples the following week.
The next week was the real run-through. From our ground tissues, we selected three 100
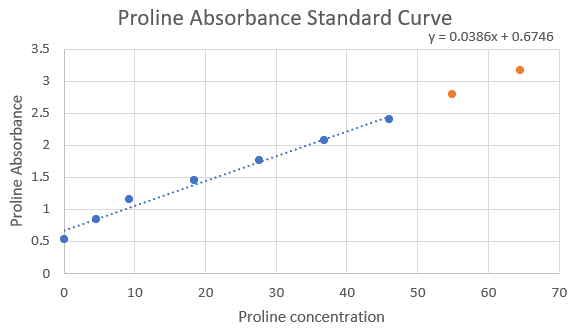
mg samples from each of our two species. We created a standard curve of proline by doing a
dilation of the proline standard and distilled water. The concentrations of proline measured to
create the curve were 46, 36.8, 27.6, 18.4, 9.2, and 4.6 μL/mL. To each of our tissue samples, we added 1000 μL of 3% sulfosalicylic acid and mixed it together with a pin. This took a lot more time than we expected, and for this protocol, time was very important, so it’s a good thing we had some practice from the previous week to speed things along. Next, we needed to separate the tissue from the supernatant by placing the samples into a centrifuge for 5 minutes.
Some of the samples were difficult to separate, so we had to do a couple runs through the centrifuge. To each of our 21 standard test tubes and 6 sample test tubes, we added 100 μL of 3% sulfosalicylic acid, 200 μL of glacial acetic acid, and 200 μL of acidic ninhydrin. To our sample test tubes, we took 100 μL of supernatant from each of our tissue samples and placed it into their respective tube. To finish off the test tubes we placed them in a hot water bath of 96 °C for one hour. We then pipette 100 μL of each sample into a 96 spot well plate following the plate map. After that, we inserted the well plate into the spectrophotometer and ran the program at 520 nm. Leaving us with the data in an Excel spreadsheet we turned it into a standard curve. From there we measured the concentration of proline based on the value of the line of best fit, finding that Sample 1 had a concentration of 55.0 and Sample 2 had a concentration of 64.5.
The difference in concentration between our two species gives us a good idea about
different plants’ ability to react to abiotic stressors. In this protocol, we saw the proline
concentrations of two plants, and in the future, we could see the concentration in many more
species to see how proline compares to other drought response factors, such as stomata size and density.