5 April 2024
By: Arya Haala & Elenore Milde
Since our last update, we chose two genes to research, ADAM9, and BHLHE40, and designed three primers for each gene. We continued our work with PCRs and gel electrophoresis by adapting them to fit our unique needs. Most notably we worked with a temperature gradient to find the temperature our primers worked best at. As research continued, we threw out two primer sets from each gene, keeping the most effective one for each.
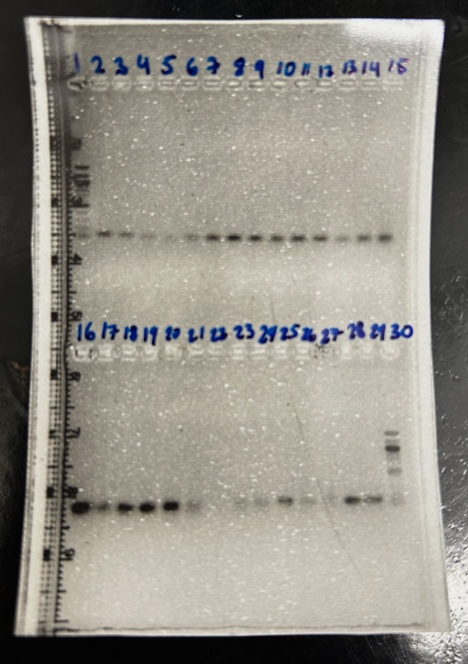
During trouble shooting we used PCR and gel electrophoresis to get clear bands at the correct amplicon size. The size was based on the region of DNA the primers amplify. Once we got the seemingly correct amplicon, we started PCR cleanup to isolate the additives from our gene amplicon. To do this we used 10 μl of our PCR samples and ran a gel to ensure our samples were good. After we confirmed our band sizes were a match, we began our PCR cleanup so we could send out a clear sample for sequencing. We used the remaining ~15 μl of our mixture and 5 volumes of DF Buffer in a column. Centrifuging it and adding 15 μl of Elution Buffer before centrifuging it again. We used the Nanodrop with 1 μl of our solution to measure the DNA concentration and purity of ~1.8. Our purity was a little low, but we continued. We used C1V1=(1 ng/μl)(15 μl) to determine the amount of water needed for sequencing. When this was done, we added the solution, calculated water volume, and 1 μl of the genes forward primer to a PCR tube. This was then sent out for sequencing.
When the samples came back from sequencing, we used the 4Peaks software to analyze our data. Our results came back with a 100% match for ADAM9 and a 95% match for BHLHE40 in the NCBI database. This led us to put the primers away for future use before moving to RNA isolations.
We did two practice RNA isolations on liver tissue to ensure we are ready for real brain tissue. To do this we took one third of a frozen liver sample collected from green anole lizards and homogenized it with 1 ml QIAzol to stop the RNA from degrading. That sat for 5 minutes, then we added 200 μl of chloroform and vortexed. It sat again for 2 minutes before centrifuging at -4°C for 15 minutes. After the 15 minutes was up, we had three layers: clear, white, and red. We pipetted the top clear layer into a new tube getting approximately 600 μl, then added the same amount of 70% ethanol and vortexed to mix. Then we added this new mixture into a column, discarding all flow through. We added 350 μl Buffer RW1 and centrifuged twice then 500 μl Buffer RPE and centrifuged twice more. Following this we used 30 μl of RNA-free water and centrifuged two times using the same water. After this was complete, we used 1 μl of our RNA solution and the Nanodrop to test the concentration and purity.
Both of our liver tissue samples had an ideal purity of ~2 and a concentration that was good for the mass of tissue. Because our samples worked, we used a gel to determine if our RNA had band sizes at 185 and 285 base pairs. Through gel imaging, we determined our samples had good band sizes. Since both of our practice samples went well, we started our first RNA isolation using brain tissue. The difference between brain and liver tissue in RNA isolation is now you will add two steps in the protocol using DNase to make sure all DNA has been transcribed into RNA.