
12 APRIL 2019
By Megan Scheffe & Jane Sakowicz
Brief Introduction to Gene GPR 156
G-protein coupled receptors (GPR) belong to a large family of versatile cell surface receptors to which ligands bind. They are classified by seven helical transmembrane domains (ncbi.gov, 2019). There is very little information known about the GPR 156 gene in the green anole lizard as well as in humans. According to the National Center for Biotechnology Information, there is some information available about this particular gene in the human genome. In humans, GPR 156 is highly expressed in sexual reproductive structures. GPR 156 is expressed in the endometrium (the mucous membrane layer on lining of uterine wall), the ovaries, but is predominantly expressed in the testes. This gene is also moderately expressed in the brain.
Procedures Conducted in Lab From 4/1/2019 – 4/11/2019
PCR Clean Up and BLAST of DNA
We worked with our Primer Set two for our gene GPR 156, which was obtained in a similar fashion to previous blog posts. We performed a PCR clean-up, which works to eliminate all other particles other than the amplicon, which will eventually be sent to a company who can sequence our DNA to make sure we are looking at the same sequence as our gene. The reason this step is necessary is because there could be another amplicon of similar length that we amplified rather than our target gene.
PCR Cleanup
We started our PCR clean up by pipetting the rest of our PCR sample into a microcentrifuge tube and we added DF buffer that was five times the volume of our PCR sample volume. We pipetted this solution onto a column, and then we centrifuged and discarded any flow through. The rest of this protocol consists of pipetting different buffers onto the column in order to wash the sample, and then the tubes with the columns are centrifuged to spin out excess liquid.
We must then test the concentration and purity of our sample to make sure the quality is still good for further testing and sequencing. In order to test these two properties, Megan and I used a machine called a nanodrop. The nanodrop is a machine used to analyze the purity of a sample whether it is RNA, proteins, nucleic acids, etc. Our sample had a purity of 1.46 A260/A280 and a concentration of 3.4 ng/ul, which are appropriate numbers to obtain. We then sent our results to a lab to sequence our DNA.
BLAST
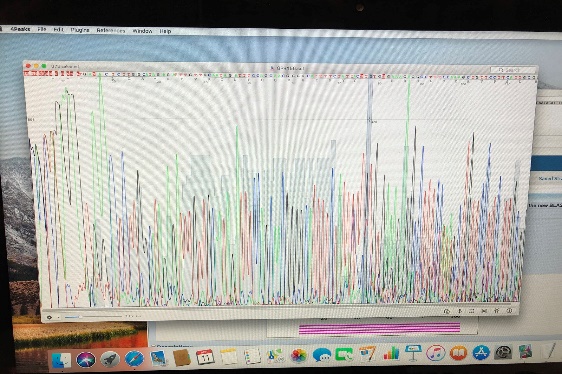
When our results came back, we received the data from an image provided after the lab had done capillary electrophoresis. Capillary electrophoresis uses different colored waves to indicate which nucleotide is present in the sequence on the order it appears in the DNA sequence. High peaks show a high probability that that specific nucleotide is the actual nucleotide present in the sequence. Some areas in the sequence are represented as “n”, which indicates that the nucleotide sequence in that area is uncertain. We then turned this sequence into a file that could be inputted into the BLAST function on the National Center for Biotechnology Information website. After BLASTing our DNA sequence, we were able to conclude that the sequence we amplified during PCR was the correct sequence for the GPR156 gene, and not another amplicon of similar length.
RNA Extraction on Liver Samples for Practice
In lab, we performed RNA extraction procedures on a liver tissue sample from the Anolis carolinensis. We did this to practice the procedure so we could show Dr. Cohen that we are capable and understand the procedure enough to do it on a tissue sample of an Anolis carolinensis brain.
We used the procedure given to us by Dr. Cohen to extract the RNA from the liver tissue that was provided to us and stored in the -80℃ freezer. The liver is stored at this temperature to prevent the RNA from degrading. After we followed the RNA extraction procedure, we ran it through a 1.5% agarose gel electrophoresis imaging sequence to determine the extracted RNA integrity. For example, if it was degraded, contaminated, or if the RNA extraction procedure was done incorrectly, we would not be able to visualize the distinct bands on our gel.
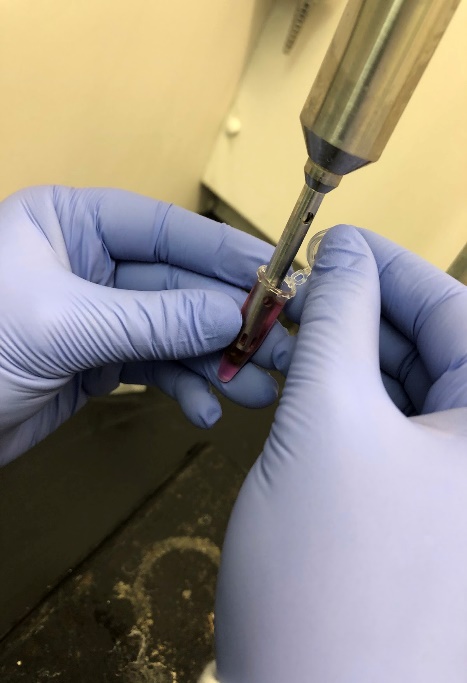
One of the main scientific instruments we used and were introduced to for the RNA extraction was the homogenizer. A homogenizer is used to break up the tissue that the RNA is being extracted from. It breaks up the tissue to the point where the tissue or any particles and bits are no longer visible to the naked eye. This allows for an intensive mixing process of the finely broken down tissue as well as the liquid it was stored in and homogenized in. The homogenizer allows for the extraction of various analytes.
After the liver sample was homogenized, we spun down our homogenate in a refrigerated centrifuge for 15 minutes. This allowed the solids to separate from an aqueous layer, which was later carefully pipetted out and placed in a labeled microcentrifuge tube. We then followed protocol and eventually added a DNase solution in order to destroy any remaining DNA because we just want to look at the quality of the RNA. Following the protocol, we eventually added a few different buffers, spinning them down and discarding the flow through after each buffer.
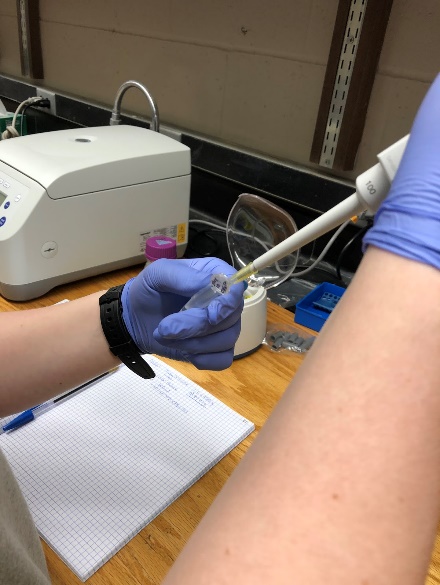
Once we had our isolated RNA from the liver sample, we used a nanodrop to check the quality of our sample. Then, to determine the integrity of our RNA, we ran 2µl of our RNA sample and 3µl of loading dye on a 1.5% agarose gel. To make this gel we mixed 0.75g of agarose with 50ml of TAE Buffer. After dissolving the agarose in the buffer, we let the solution cool before adding a dye to visualize the bands on our gel. We pored our gel into a casting tray and put a comb at the top of the gel in order to create wells, where our sample will be loaded. After the gel was completely settled, we loaded a 10µl of 100 bp ladder in well one for comparison to our RNA. In the second well we added our 5µl solution that held our RNA sample. We placed the casting tray in a gel electrophoresis machine, making sure the wells will run from negative to positive, since RNA is negatively charged. The RNA runs through the agarose in which the smaller sized RNA will run along the gel faster than the larger sized RNA.
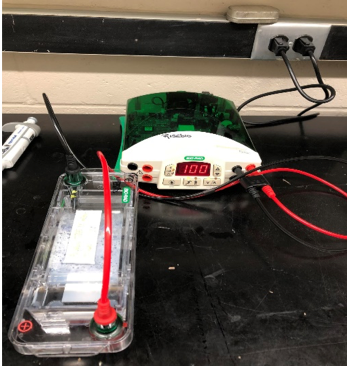
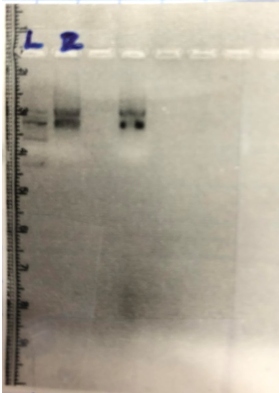
After running our gel for approximately 30 minutes, we imaged our gel to visualize potential bands. We obtained the two bands like we wanted, showing that our integrity for our RNA liver sample was good.
Next Steps
Our next steps will be to extract RNA from a variety of brain samples from green anoles. We will also learn how to do qPCR on our extracted RNA.