13 October 2023
By: Aveya O’Donnell, Madisyn Jarvey, Gustav Pieper
Our group has been focusing our research on the brain and gene expression of green anole lizards (Anolis carolinensis) during the breeding and non-breeding seasons with respect to the male and female lizards. The gene that we have been using to focus our research on is Myoneurin or MYNN. MYNN is a regulatory protein that acts as a transcription factor, which regulates the function of other genes in the body. Over the course of the past two weeks, we have become familiar with a new process which is quantitative PCR, or qPCR and standard curves.

in order to load it onto our gel for gel electrophoresis
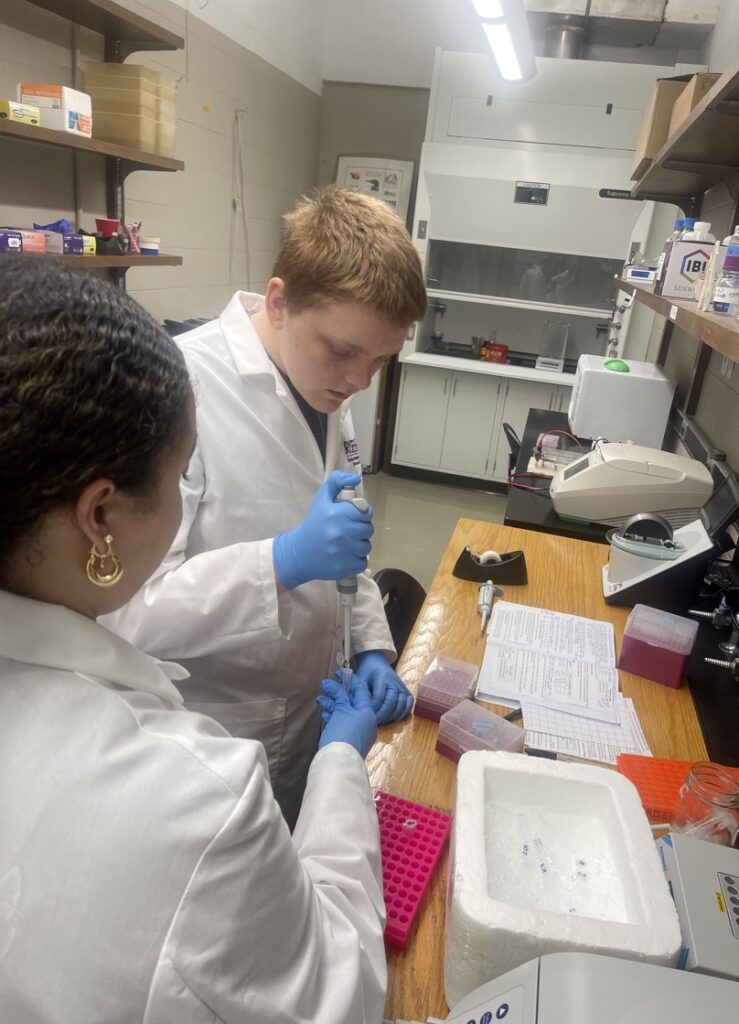
In the last few weeks, our group has been using our MYNN gene and Beta-actin to run qPCRs and standard curves. Before we could move on to our two genes and eight cDNA samples, we practiced a standard curve with colored water that we diluted and pipetted into a 96 well plate. This helped us prepare for the real standard curves since this is a tedious and time-consuming process. Since learning these new protocols, we have run two standard curves with primer set four of our MYNN gene. Both of those results did not turn out how we had hoped. Our group ran a gel electrophoresis which showed us that we had contamination in our no template control, an efficiency around zero, faint bands, and no close replicates for both standard curves. This could have been from bad pipetting and issues with our MYNN primer. Good results of a standard curve that we are looking for are no amplification in our NTC, a single peak in our melt curve, close replicates, and a standard curve efficiency between 1.9 and 2.1. Once we get the standard curve results, we analyze it using an excel sheet to calculate the averages and efficiencies. This will be super helpful once we move on to our eight cDNA samples because we will use the standard curves to calculate the mRNA expression of the unknown cDNA samples. Soon, our next steps will be to run a qPCR and standard curve on Beta-actin. Beta-actin is used as a control because it is expressed evenly between all four test groups. Once we have gotten good results for our MYNN gene and Beta-actin, we will take all our cDNA samples we made and run another qPCR standard curve.

In conclusion, our results have not been what we wanted, but there are many different options to trouble hoot. We could adjust our primer concentrations or adjust the annealing temperature.
For example, we will have to use beta actin and our normal cDNA to rule out the possibility our gene is just not showing up in the qPCR. After that we will have to adjust the concentrations of the sample to make the primers stick to our cDNA. Even though our setbacks we have learned a lot from our experiences with this experiment. We’ve also gotten better at figuring out how to pipette better and we have been troubleshooting this entire way on figuring out new strategies to go forward. We still haven’t gotten a good efficiency result yet, but we are solely narrowing down the choices and we will show how our gene is being exposed differently in the different green anole population.

