
29 September 2023
By: Ellie Malone, Emma Rieper, Anna Wilcox
The past two weeks we have been working on the preliminary steps of conducting a quantitative PCR (qPCR) on our two genes, ZYG11A and HS6ST1. This includes troubleshooting our genes using steps such as PCR and gel electrophoresis for imaging. Alongside this process, we have also been working with cDNA that we synthesized, confirming that the samples are viable. We practiced serial dilutions using colored water and practiced pipetting into a 96 well plate using a map and colored water. These steps have been very beneficial in preparing us for success when we inevitably do a real qPCR on our genes.
During these two weeks we have completed a few different PCR and gel electrophoresis protocols with different CDNA and beta actin samples. For our PCR protocol we first calculated the volumes of Quick-load TAQ 2x, forward primer, reverse primer, and water needed for our master mix. Both the forward and reverse primers are specific for our gene(s). By pipetting, you combine all these reagents in microcentrifuge tubes, vortex, and then centrifuge. Next, we aliquot a specific amount of the master mix into PCR tubes for each reaction. For the positive samples, we added CDNA and for the negative samples we added water. The negative control allows us to see if there is contamination in the master mix. We placed our samples into the thermocycler that runs a cycle of varying temperatures that runs for around 2 hours.
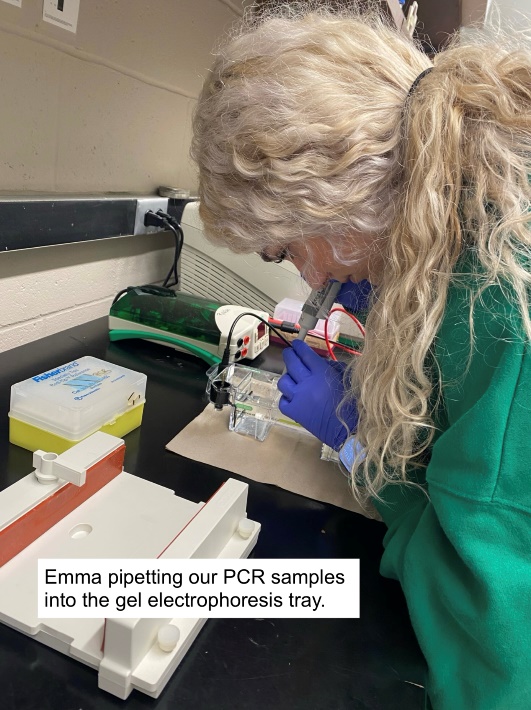
We performed a gel electrophoresis on the PCR that we had made the week prior. Gel electrophoresis is a multi-step process with multiple rest periods in between the steps to allow various reactions to happen. The reason for a gel is to see if your DNA or CDNA will give you the correct “band size” based on the number of base pairs of the amplified sequence. The band is compared to the “ladder”, which shows a range of band sizes. If your sample does not reach the correct band size, there may have been something wrong during your experiment. You can also get bands called “primer dimers”, which means that the primers are binding to themselves instead of the gene of interest. To complete gel electrophoresis, you first need to weigh out the agarose powder and 1xTAE buffer and swirl them together in an Erlenmeyer flask. You then need to dissolve the agarose in the 1xTAE buffer by placing it in the microwave for short increments and swirling it until it is fully dissolved. A dye is then added to this mixture to make the bands visible in the gel image. The mixture is poured into a gel cast, comprised of a comb, which creates the wells, and a gel tray, which holds the gel. This is then cooled for about 30 minutes and then placed into the gel box. A base pair ladder and samples are pipetted into the wells, covered with 1xTAE, and then the cover is placed on the gel box and the machine runs a current through the gel. This runs for approximately 25 minutes.
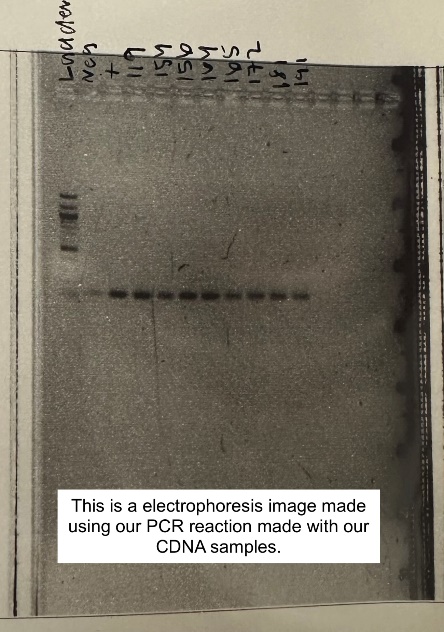
Imaging the gel allows you to see what band sizes each sample created. This is done with a gel imaging machine. You place the gel in the drawer and then go through the imaging protocol on the computer. You should end up with clear, dark bands, as seen in Figure 2. PCR and gel electrophoresis is done very often to ensure that our primers are still working and amplifying at the correct number of base pairs for the selected gene.
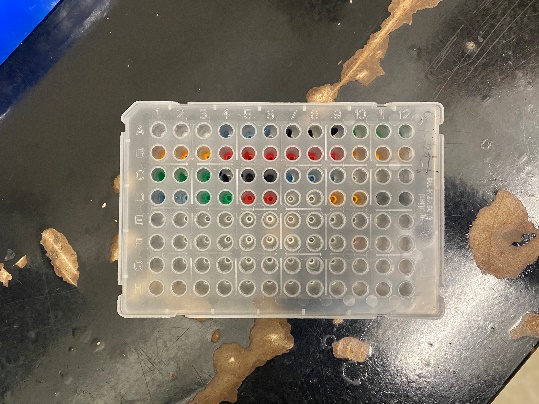
We practiced serial dilutions and pipetting into a 96-well plate for our qPCR experiment coming up. For the serial dilutions we labeled our tubes, added the calculated amount of water to each respective tube, and then created three different concentrations of a solution from a “stock solution”. For the 96-well practice, we pipetted colored water into the wells (as seen in Figure 3.) to make sure that we could keep track of where we were on the well plate.
The last thing that we completed was a qPCR reaction for both genes ZYG11A and HS6ST1. We are making a standard curve for both genes. Unlike a regular PCR in the thermocycler, a qPCR uses fluorescence to measure how much of the amplicon is in each sample after each cycle. The higher the fluorescence, the higher the concentration. This measurement gives you a graph that can be used for future reference to determine how concentrated the amplicon is in a sample. To start the qPCR, first, we had to calculate the volumes of PowerUp SYBR green 2x mix, forward primer, reverse primer, and water for the master mix. We then had to create 3 standard curve dilutions with the CDNA that we have been using for our PCR’s. For the 3 dilutions we had Int-1, Int-0.2, and Int-0.04, which were three different concentrations. During this procedure you need to aliquot sample from one sample to the next to create the dilution. We then made a PCR master mix with PowerUp SYBR green 2x mix, forward primer, reverse primer, and water. We created a 5-standard tube with master mix and water. Throughout the protocol, you add water as you aliquot to dilute the master mix. We then drew out a map of where we were going to pipet out samples into the 96-well qPCR plate. After all of these tubes are made, we pipetted 15 microliters into each of the wells in the plate. This plate was then centrifuged and placed into the qPCR machine for ~2 hours.
In these past two weeks we have created multiple PCR reactions, followed multiple gel electrophoresis protocols, practiced serial dilutions and pipetting, and created a qPCR reaction to make a standard curve. We have learned a lot of new procedures and learned a lot about our genes, ZYG11A and HS6ST1. We will continue examining our qPCR results and figuring out our next steps with our genes. Understanding qPCR will be critical for us to understand how ZYG11A and HS6ST1 are expressed in green anoles during breeding and nonbreeding seasons. RISEbio and our continuous research has offered us many great opportunities in and out of the lab. We are becoming much stronger with our laboratory skills, and we are very glad to be getting strong results for both of our genes ZYG11A and HS6ST1.