20 November 2020
By: Alexus Bunnam And Taylor Grossen
Sadly, our time with RISEbio has come to an end. This is our last blog post. We started our college experience out not knowing what a micropipette was. Now, three semesters in, we successfully completed our experiment. At the beginning of our research it was a struggle. As time progressed, we became more familiar with how to read protocols, we understood each other more, and became more comfortable in a lab setting.
The last protocol we shared with you all was about RNA isolation. Now we have moved onto the final protocol in our research stream which is quantifying PCR. qPCR uses fluorescent dye to quantify/measure a targeted DNA molecule. In our case, we are quantifying PER1 in brain tissue samples of anole lizards. We performed a total of three qPCRs. Our first qPCR was testing our stock cDNA with our primers. The second was a beta actin qPCR a control, and we quantified all 24 cDNA brain tissue samples (includes all tissue samples within the stream). These results will be used in later statistical analyses. The third qPCR was with our designed primers. We quantified all 24 cDNA samples again, but this time measuring the expression of PER1. For all three of the qPCR’s we generated standard curves.
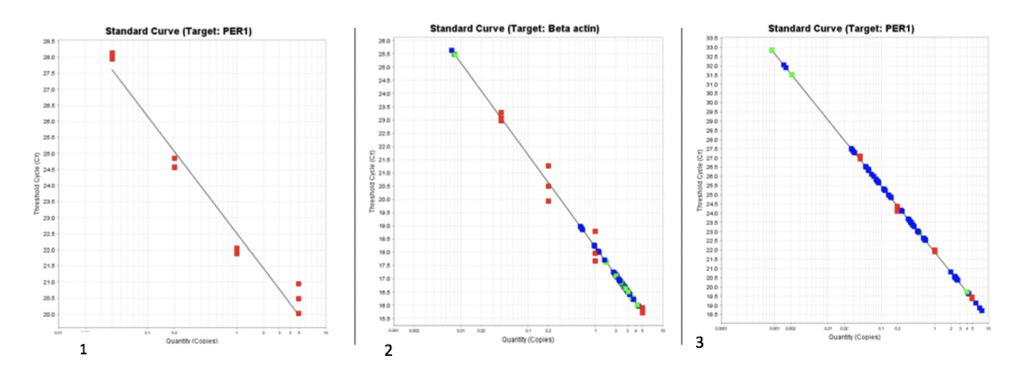
A data analysis was done for each of the qPCRs. With each standard curve an efficiency was calculated. An optimal efficiency number would be about 2.0. The standard curves using the PER1 primers had an efficiency number of 1.8848 (graph 1 and 3). The standard curve containing beta actin primers had an efficiency of 1.9378 (graph 2). With further data analysis we calculated the mRNA in both beta actin and PER1. We then took the mRNA results of PER1 divided by beta actin results and put the data through SPSS, which is a program that will conclude whether our gene was upregulated in the breeding season or in the non-breeding season and if it was upregulated in males and females. Based on our results there was no variation in the expression of PER1 in the breeding or non-breeding season and within males and females. Although we had a successful experiment this was not the results we expected.
Lastly, in the next following weeks we will be working on creating our poster and updating our abstract. We will then be presenting our findings to other RISEbio members and eventually to other faculty members at MNSU.
These last few weeks we felt a lot of anticipation and excitement. All the hard work for the past year and half is finally showing significant results. Our experience here was incredibly rewarding and we are thankful to have gone through the program. We would like to thank all the people that has helped us through the RISEbio program including Dr. Cohen, Dr. Sharlin, Dr. Land, Cai, Maria, Jane, and Nicole. The things we have learned, felt, and experienced will be applied to so many other classes as we progress through college.