
3/15/2021
Eli Landas, Lauren Buysse, & Aidan Forberg
Introduction:
The purpose of the past few weeks have been to amplify our miRNA hsa-miRNA-4314 and hsa-miRNA-4786-3P. It has been a struggle to get results from our miRNA in the form of visible bands in an agarose gel. We have had to test different annealing temperatures (allows DNA to bind to primers that help make the gel work) as well as multiple attempts at PCR to figure out what steps in the process were causing the lack of results.
Research:
On our first attempt to amplify our miRNA, we used the annealing temperature of 72 degrees Celsius that we got from plugging in our miRNA sequences into a website called “NEB Tm Calculator” (http://tmcalculator.neb.com/#!/main). With this information we ran a trial and had no positive results. When searching for what went wrong, we found out we had used too high of an annealing temperature. For the next trial we used the annealing temperature of 66 degrees that we got from plugging our sequence into the website again more carefully. Although this temperature was accurate, we were not able to see our ladder (which helps us determine the number of base pairs located) on our gel or the bands from miRNA hsa-miRNA-4314 or hsa-miRNA-4786-3P. Since we couldn’t even see our ladder, we speculated that we did something wrong when dying our gel. We tried soaking it in ethidium bromide but still no bands appeared.
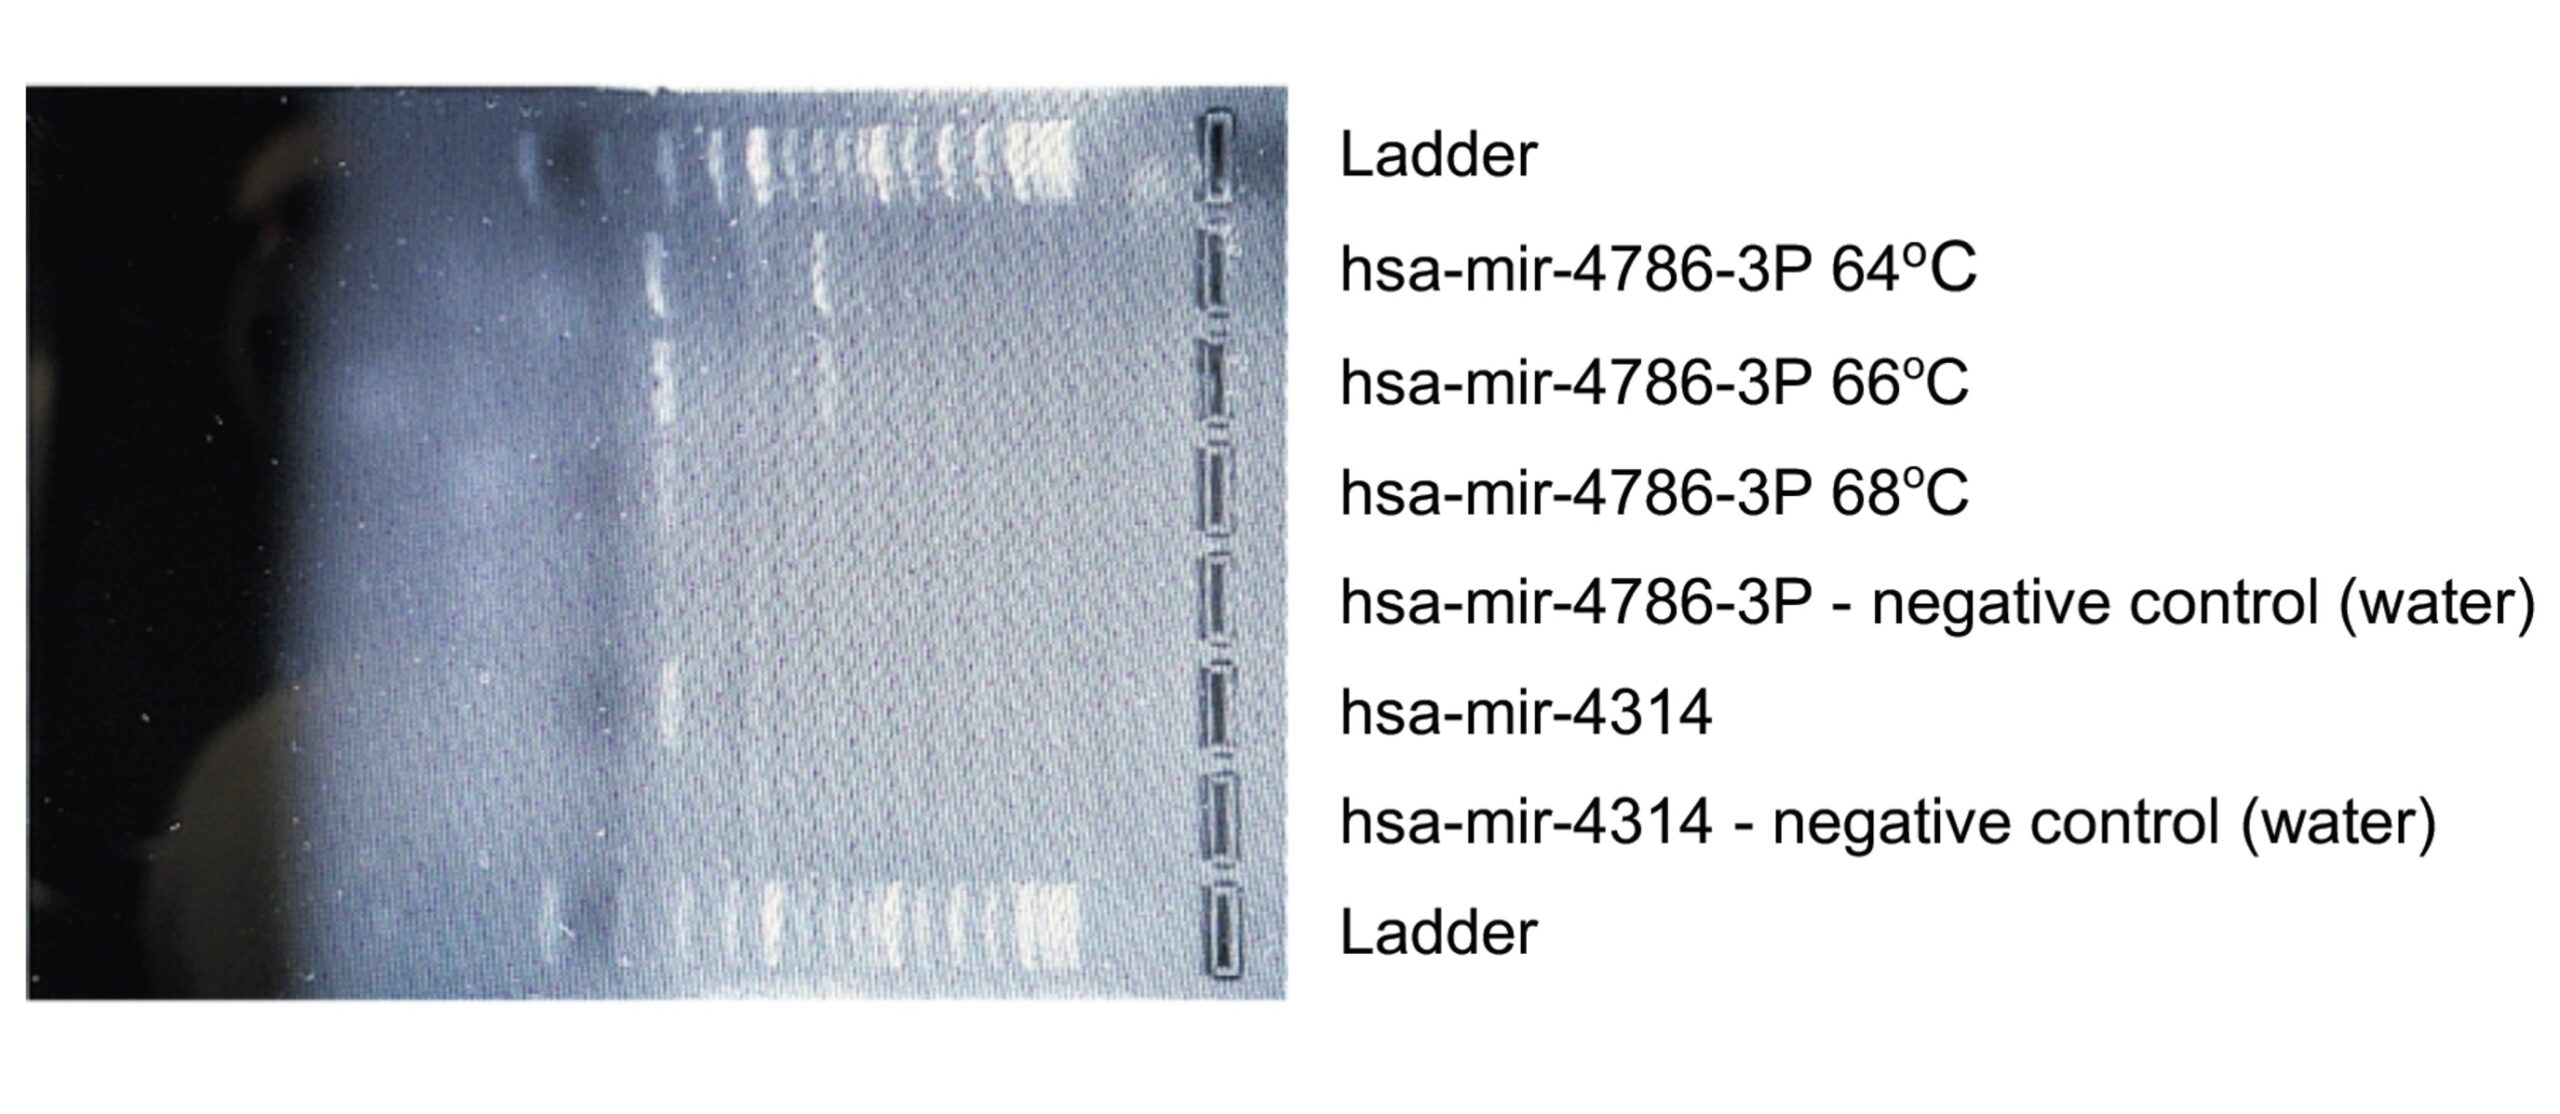
On our final trial, after seeing a good band for hsa-mir-4786-3P, we tried to do a temperature gradient PCR for that miRNA and a new PCR product for hsa-mir-4314. After running the gel, we saw strong bands for all four PCR samples, with the coolest temperature in the gradient for hsa-mir-4786-3P (64 degrees Celsius) being the strongest band. We also observed an extra band for both the cooler temperature and the original annealing temperature. We think that is another part of the genome that our primers bind to during annealing. Neither of our controls showed a band which is a positive result for us and shows us that there wasn’t any contamination in our samples.
After seeing successful results of miRNA amplification, we did a PCR Purification. After running that, we got very pleasing results. For our hsa-mir-4314, we got a concentration of 16 μg/μL, a 260/230 ratio (indicates salt contamination) of 0.34 and a 260/230 ratio (indicates protein contamination) of 1.07. For our hsa-mir-4786-3p, we got a concentration of 9.1 μg/μL, a 260/230 ratio of 2.0 and a 260/230 ratio of 0.95. As mentioned before, all of these numbers are very pleasing, and we feel very confident in our final PCR Purification product.
Reflection:
Regardless of the adversity we have faced in the past few weeks we feel that we are still moving at a steady pace. Setbacks are expected while conducting research and can be thought of as a way to improve our critical thinking skills while the repeated tests allow us to gain repetitions to feel more comfortable in the lab. We are now looking forward to beginning genetic transformation in bacteria using E. coli.