
February 6, 2024
By Wren Poessnecker and Logan VanGuilder
In the first month of our research stream, we have already done three separate experiments. Those experiments have been seed germination, stomatal pore measuring, and osmosis labs.
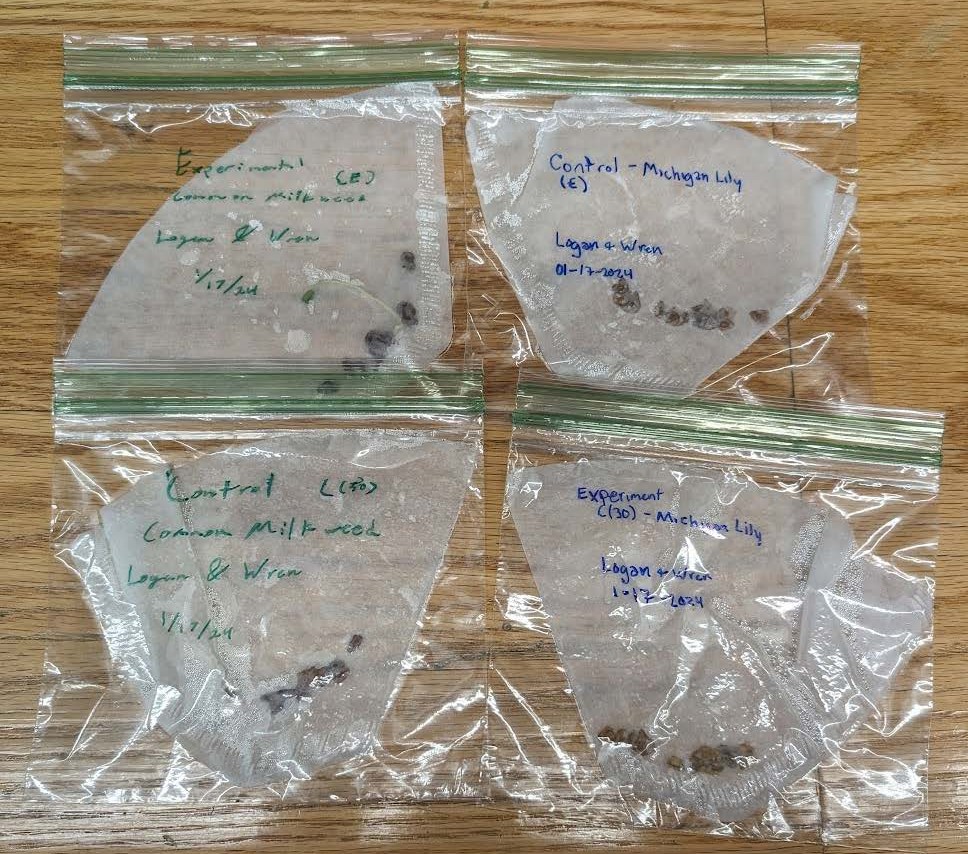
To begin the semester we started by working on a seed germination experiment. We began by choosing which of the common germination codes we would be experimenting with. The ones that we chose to go with were germination codes C30 and E germination code C30 has the seeds germinate in cold moist areas for four weeks, while germination Code E calls for 2 weeks in a moist warm environment followed by two weeks of a cold moist environment. We chose one plant that is traditionally a C30, common milkweed (Asclepias syriaca), and one plant that is traditionally an E, the Michigan lily (Lilium michiganense). We are testing how both plants respond to both environments. Our hypothesis is that both plants will respond better in their native environment. We are testing this by putting 15 seeds per plant per germination code in a wet coffee filter. We then put each in a separate ziploc bag and put them each in their germination code situations. Each week we check
for growth and abnormalities. The first week we found large amounts of mold on the E plant seed’s coffee filter but after changing the filters it never happened again. So far two weeks have passed and only one seed has begun to grow, a seed from the E germination of the common milkweed. This result was highly unexpected considering it is typically grown in a cool environment and we had it in a warm environment at the time it began to sprout.
We started our second experiment about the stomatal pore index (SPI) of different plants on January 24th, and finished it on the 29th. The purpose of this experiment was to help us understand how the SPI of different plant species varies based on their climates. Since the stomata of plants is used for gas exchange as well as the expulsion of water, the SPI of a plant can tell us a lot about how it has adapted to live in its environment. We started the experiment by selecting 3 leaves each from 2 different species in the greenhouse that we expected to have variation in their SPI.
The 2 species selected were Tradescantia pallida (purple queen spiderwort) and Geranium robertianum (herb robert). T. pallida can be found in eastern Mexico, it has large, smooth, and thick leaves with a deep purple color. G. robertianum is commonly found in Europe, but can also found in other parts of the world. It has much smaller leaves that are thin, hairy, and green. After gathering our leaves, we began the process of gathering leaf peel impressions. We painted the underside of each leaf with roughly 1 square centimeter of nail polish. Once the nail polish dried, we used tape to peel it off and attach it to slides. We had few issues getting the impression from the T. pallida leaves, but the G. robertianum leaves were too thin and hairy to successfully peel the impression, so after attempting to shave off the hair, we waited for the nail polish to dry more while examining T. pallida under the microscope. Using the microscope, we examined the number of stomata in an area and the average length from 3 separate stomata for each leaf.
Across the 3 leaves of T. pallida, they had an average count of 9 stomata with an average
aperture length of 0.0524 mm. As we were running out of time and the G. robertianum
impressions were not peeling correctly, we wrapped up for the day.
We continued the experiment on January 29th by selecting a new plant from the greenhouse to replace G. robertianum. The plant selected was Querus virginiana (southern live oak). The leaves we gathered from Q. virginiana were small, smooth, round, and green. To get an impression from these leaves we followed the same process as before with the nail polish, but we had a much easier time with this plant. Under the microscope, we found an average of 619 stomata with an average aperture length of 0.0103 mm. For each species we followed a series of calculations that gave us our mean stomatal density. For T. pallida it was 10.869 mm2 and for Q. virginiana it was 708.548 mm2. Overall, we had extreme variation between our selected species with T. pallida stomata being large and spread out while Q. virginiana stomata was almost 5 times smaller and much more condensed.
Our third experiment was demonstrating osmosis and was split into 2 parts: observing osmosis in potato cells and observing plasmolysis in Elodea leaves. The purpose of the first part was to observe the effects different concentrations of salt water has on potato cells due to osmosis, and the purpose of the second part was to observe the process of plasmolysis in Elodea from osmosis. We performed this experiment on January 31st and February 5th.
For the first day, we began part one by preparing 4 different test tubes with 10mL of varying concentrations of salt water (distilled water, 1% salt, 3% salt, and 5% salt). Each tube was given 3 cylinders of potato that were each 3 cm long. Prior to being placed into their tubes, each group of potatoes were massed. Since it can take a while to fully observe the effects of osmosis, we left the potatoes in their tubes until the following Monday (Feb. 5). We had some time left on day 1, so we decided to continue onto part 2 of the experiment. For this part, we first observed Elodea cells under a microscope, then we exposed them to a solution of 5% salt water and recorded the changes. Nothing out of the ordinary was viewed until we added the salt water solution, but almost immediately after, the cell membranes began to shrink and pack in all of their organelles. Even though the cell membranes of the Elodea cells shrank, the cell walls remained intact and mostly unchanged.
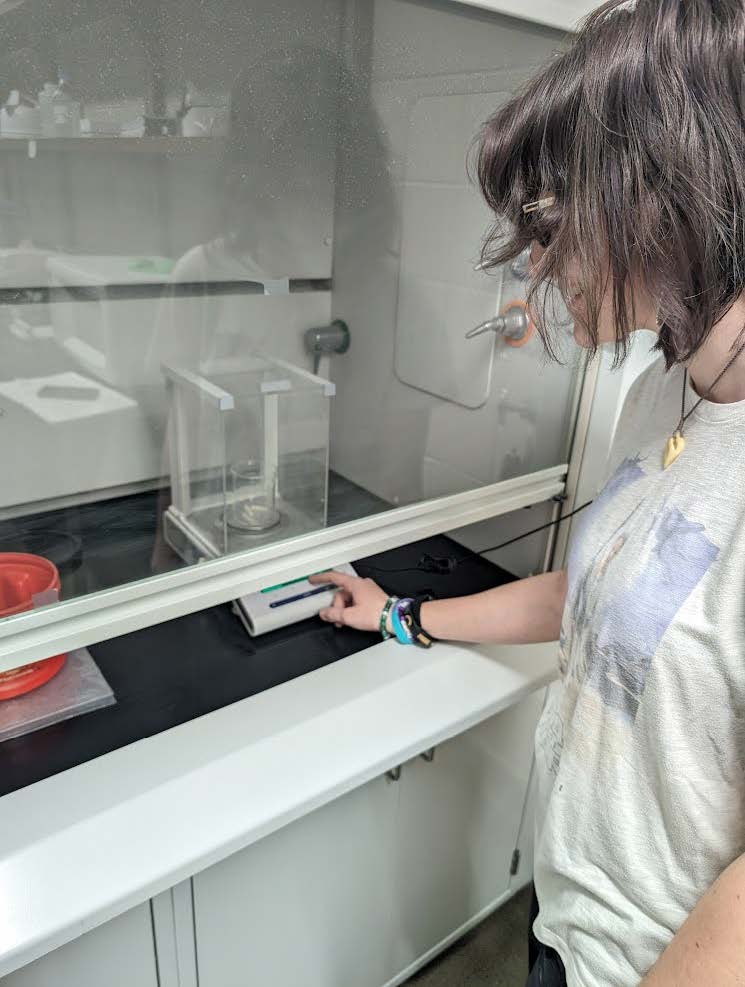
Wren measuring the weight of potato cores.
On the second day of the experiment we recorded the mass of the potatoes again and noted the change in mass. In the distilled water, the potatoes started with a mass of 3.06g and ended with 1.03g for a change of -2.03g. This change was unexpected and is likely inaccurate due to all the potatoes in the tube losing all structure and becoming a mush. The 1% salt solution potatoes began with a mass of 3.28g and ended with 3.64g for a change of +0.36g. This solution had the most structured potatoes out of all the groups, but it was still a little squishy. In the 3% salt solution, the potatoes began with a mass of 3.20g and ended with 2.53g for a change of -0.67g.
This group of potatoes also retained their shape, but were less structured than the previous
group. The group of potatoes were in a 5% salt solution, they began with a mass of 3.71g and ended with 2.99g for a change of -0.72g. The potatoes in this group had a very similar structure to the potatoes in the 3% salt solution group, keeping their structure but still squishy. In the end, we were able to see that the change from a 1% salt to a 3% salt solution was the greatest and rate of change was lower as the concentration increased. It can also be assumed that the cells of the potatoes in the distilled water absorbed too much water and burst through the cell wall, since they lost their structure and became a sludge.
Overall all of the experiments went well, but had some unexpected results. As of right now the only one to sprout in our germination experiment is the common milkweed in germination code E, which is not its natural environment to be grown in. In the potato cores, the zero percent solution cores turned completely to mush while the one percent cores were the most well-maintained shape-wise. We look forward to seeing how our seed germination progresses and the experiments we have coming up.