
Makenzie Reed and Bola Ogunlana
24 October 2019
Introduction
This semester we have been practicing new procedures as well as the statistical analysis of our data results. On our last blog we ended with the procedure known as cDNA synthesis of all of our samples. cDNA synthesis is the transformation of RNA, which is very unstable, to DNA that’s more stable. The cDNA that we have made allows us to run a new test, a qPCR, in order to quantify the amount of DNA that is present at each cycle. From the information gathered from this test, we will be able to perform a statistical analysis. The statistical analysis will allow us to determine whether or not our gene, MTNR1A, is upregulated during the breeding or non-breeding season, answering our big question in this research stream.
Our Processes
Since we last left off, we have been able to tie up a few things that we were still working on. We were unable to obtain a good result from our RNA extractions after trying a few more. We have a few hypotheses on why we think our RNA extractions were not working as they did last spring. The first idea is that there may be some contamination within the kit that we use. This kit is used by all of us in the Brain and Behavior Stream, so an accident may have happened causing contamination and voiding the kit. Another hypothesis that we had is just that we were rusty on the process of an RNA extraction and we were just too slow and the RNA was degrading before we were able to finish. Although we came to this hypothesis, we do not know if this could actually be an error. This is because we have done the process with lots of prep prior to coming into the lab, speeding up the process, and did the process with the help of our lab TA, and it still did not work. Many of the runs that we did were faster than our fastest run last spring, and we got good results on the last semesters RNA extractions. Because we did not want to get stuck at this step for longer, it was decided that it would be best just to get some RNA that was already made to replace our sample.
As this was finished, we were able to move onto the finishing up our cDNA synthesis. Once we made the last two RNA extractions into cDNA, we were able to run a gel check for all of the cDNA samples that we made. To do this, we first ran a PCR for all of our cDNA samples with our primer set that we have chosen to work with. Then, we ran a gel to visualize our results. The bands on our gel should be in the same spot as they were when we ran our PCR last spring with the premade cDNA. Overall, we were pretty pleased with the results of our first try of the test. Almost all of our results similar to the results that we got last spring with the pre-made cDNA. We had one sample that did not give us the results that we expected. For this sample, we could see a faint band, but it was in the right spot. In order to double-check to see if it actually did work, we ran another PCR and gel on that sample. In our second gel, we saw the results that we expected. From this, we were able to conclude that all of our cDNA synthesis samples are good and that we were ready to move on to qPCRs.
The first step of a qPCR is to practice the process. The biggest change from the PCRs that we have done in the past and what we are currently doing is the type of tube we are pipetting into. Instead of having a few small tubes as we had for a PCR, a qPCR is ran in a 96 well plate. This is essentially 96 PCR tubes attached to one another. With so many spots to pipette and so many samples, there is a high chance or error if we are not careful. In order to get an idea of how we would do this, we practiced pipetting into a plate using colored food dye. This practice allowed us to get comfortable with how to read a plate map and get practice on this delicate and precise process. Doing this practice has helped us in eliminating an error that could be made by not being careful.
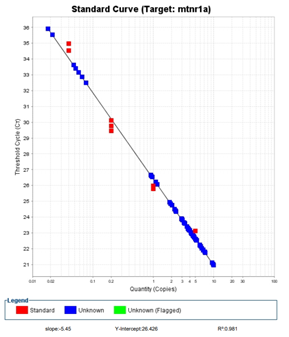
After we did this, we ran our first standard curve test. In a qPCR, every sample is run in triplicate. This is so that we can be certain that there is no error in our pipetting and to make sure that our results are similar from sample to sample. A standard curve shows us the threshold cycle for each of the concentrations that we use, 5, 1, 0.4, 0.02, and a no-template control. Overall, we used 15 wells in the 96 well plate, because each sample is run in triplicate. Because we used so few wells and because it was our first time doing the process, we ran this qPCR standard curve with the rest of the groups in our stream so we could save resources and ask questions when we needed to. We made our plate with our classmates and then took it upstairs to the qPCR machine. After the machine did its work, our results were presented to us in a graph. The line of the graph should be linear and all of our points for each concentration should be on top of one another or close to on top of one another. In our first standard curve, we got these results. Because we got these results, we concluded that we do not need to do any troubleshooting for this process and that we were ready to start our first real qPCR run.
Our first qPCR run was a little more hectic than what we thought it would be even with all the practice that we had done prior to this first run. The hardest part about a qPCR is that it has to be super organized, so you do not use the wrong cDNA sample, or accidentally put two samples in the same well, and make sure that you have very accurate pipetting skills. We took our time, made our master mix, added all of the cDNA samples. and loaded our plate. Overall, we did pretty well on this part of the process. We were able to fill almost every well with our master mix that we needed to for our reaction. We were short two wells, so what we did is we made these two wells our no template controls. We choose to run this sample in a single because it is used as a control rather than a point of actual data. Once our plate was filled, we took our plate to the qPCR machine to run the test. After a few hours, we got the results back. For our first full run, we were pretty happy with what we saw. We only had a few samples that were unreadable by the machine which is really good. Although we were pleased with what we got, there were a few downfalls of our experiment that we need to fix. The first error that we have to fix is some of our high concentration samples. No unknown sample should be above the 0.02 concentration on the standard curve and we had a few that did. We also have a few unknown samples that fell below the 5 concentration, so we need to look at those samples and try to fix them. Our standard curve was also a little weird compared to the first standard curve that we ran. None of our points were on top of one another like they were on the first run. Although we did get some good data from this run, these errors that we had made the data unusable for the statistical analysis that we will do to test for the regulation of our gene. Because of the results in our standard curve, we decided to run another standard curve.
The next standard curve that we ran gave us results similar to the results that we had on our full qPCR run. The data points did not lay on top of one another and the best fit line only touched a few of the points. We were able to come up with a few hypotheses on why this happened. Our first hypothesis is that we were inconsistent in our pipetting. A pipetting error can lead to different concentrations of the samples. Our second hypothesis is that there could be something wrong with the cDNA that we are using. We think that the cDNA could be an error because we used a different cDNA sample from the first Standard Curve that we did compared to the last two that we have done.
In order to get a clearer image of why we are getting some unexpected results in our qPCR, we have to run a gel. In our first gel run that we did, there we some problems with the gel. In a gel image, the bands should be crisp and clear. However, in the gel that we ran all of the bands are thick and fuzzy, including the ladder which is similar to a control since we know what it should look like. There are a few reasons why this could happen. One of the biggest possibilities is that we had an error in making the gel. There could also be a problem with how long we ran the gel and at what voltage we ran it at. Because this gel was fuzzy, we are unable to get clear results from it. So, we will need to carefully run a new gel in order to get results that are readable. Getting readable results will allow us to analyze the results of our qPCR and let us see where we may need to do some troubleshooting.
Future Research
As the rest of the semester goes on, we will continue to run Standard Curves, qPCRs, and gels to check the results of our qPCRs. We will continue to troubleshoot our reaction until we get results that we can take and turn into data. Once we have this data, we will be able to determine whether or not our gene, MTNR1A, is upregulated during the breeding season or not. This will be done by doing some statistical analysis of our data against a control, Beta Actin.
Once we have determined if MTNR1A is upregulated or not, we will be able to move onto a new gene if time allows. With the new gene that we pick, we will go through the same processes that we have with MTNR1A. First, we will do some research on the gene. Then, we will run a few PCRs and a gel electrophoresis to see at what temperature we can get optimal results. Once this is done, we will perform a PCR clean-up. After this, we will be able to move on to the qPCR steps. With the new gene that we get, we will not have to do any RNA extractions because we want to use the same brains that we have for the past experiments. We will only have to do a cDNA synthesis from our RNA extractions if we run out of cDNA.
Along with this, we will start working on our end of semester poster presentation. This poster will be a scientific poster that presents all of the work that we have done through the past two semesters in the RISEbio program. This will include some conclusions that we have come to within our research and some graphical results that we obtained in the research. We will present our poster to our classmates, both within our stream and the cancer and immunity stream, and to other science professors at Minnesota State University, Mankato.
Conclusion and Reflections
This part of the semester has been really interesting, particularly when it comes to learning new procedures like the qPCR which was very meticulous and allowed us to strengthen our lab skills, especially when it comes to pipetting and running gel electrophoresis’, some of the first skills that we learned in the lab. Although we did have to repeat our procedures multiple times it has only made us more confident of our lab skills. We have learned how to troubleshoot errors and have been able to recognize mistakes that we make in procedures. Throughout our two semesters in the RISEbio program, we have been able to learn more about the scientific process. We have learned that not everything will go right the first time, or the twelfth time, that you run a procedure. We have learned how to persevere through this and get the results that we want. Overall, we are excited to start the process of wrapping up our research and getting ready to present it, but sad to see our time in the RISEbio program come to an end.