
11 October 2019
By: Jane Sakowicz and Leah Cox
Introduction
Since last spring, we have become partners. This means that we combined both of our primer sets and are working on them simultaneously. So far, we have worked on a number of different protocols to move our research forward. Some things that we have worked on recently include cDNA synthesis and obtaining a standard curve for qPCR.
Research
cDNA synthesis
cDNA synthesis was a crucial part of our experiment. We performed cDNA synthesis to change our RNA (from RNA isolation) back into DNA. For this experiment, we used a heat block at 65 °C and an incubator heated at 42 °C. We put our samples into the heat block at 65 °C to denature and remove the secondary structure of the RNA in our samples. We then used the incubator for an hour to copy our mRNA into cDNA. When we put our samples back into the heat block, we adjusted the heat to 80 °C to denature the active transcriptase enzyme. We tested to see if this process was successful by running a gel.
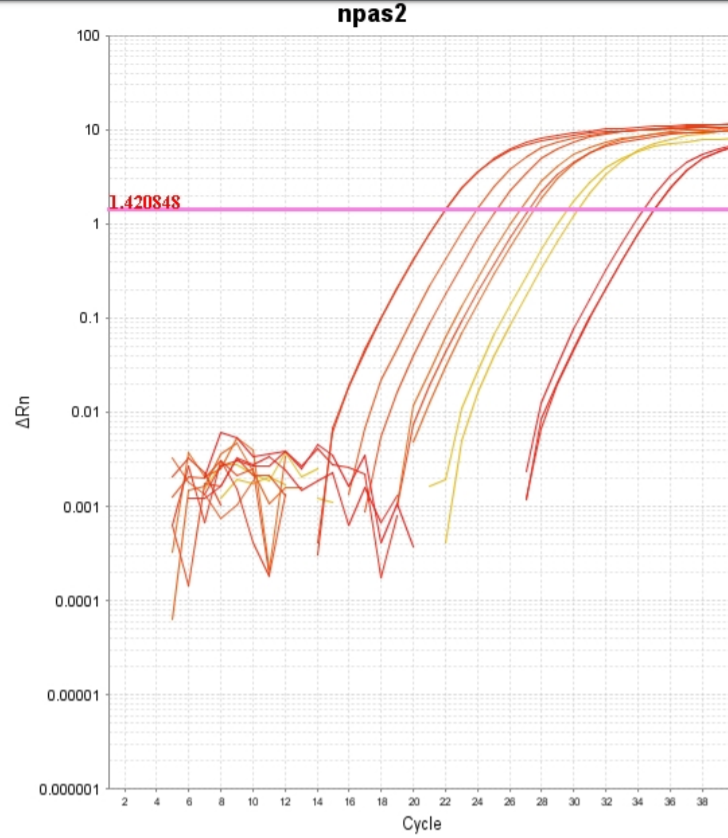
qPCR and standard curve with NPAS-2
qPCR is similar to regular PCR and is used to measure the amount of amplicons after each cycle using SYBR green in our master mix as an agent of fluorescence. The purpose of this information is to see how expressed our respective genes are, and the results we will be able to compare to a standard curve that will show us the amount of expression. First, we had to test our standards to obtain a standard curve before we use our cDNA products to run a full qPCR experiment. We used the concentrations of 5, 1, 0.2, 0.04, and a no template control and ran them in triplicate to obtain an average of all of the samples of each concentration. We made a master mix and added cDNA into each set of triplicates. We pipetted each concentration into the respective wells and ran the plate in a thermocycler designated for qPCR. While the plate was running in the thermocycler, the software tracked the fluorescence and collected other types of data to help create a standard curve. While interpreting our results with Dr. Cohen, our curve showed that each of the triplicates in each concentration did not overlap, meaning that the amplicons did not amplify at the same and/or a consistent rate. Also, when looking at our melting curve, there were multiple peaks instead of one steady peak. This means that there were either primer dimers or that the Cytosine and Guanine content was too heavy, and the triple bonds split at different rates.
Running a gel to see if there are primer dimers or heavy G and C content
We ran a gel to test whether there were primer dimers or a heavy G and C content. By running a gel we can eliminate whether it is a primer issue or a nucleotide issue. We used the same samples from the plate to run our gel and our results showed that there were primer dimers. Our next steps will be discussed in the “conclusion” section now that we have made this conclusion about the standard curve results.
Conclusion
Our next step will be to run a qPCR on primer set 2 for GPR156 to see if the standard curve shows a more promising result. We learned from the standard curve of our first qPCR that the primer, NPAS-2, had primer dimers which is what caused our data to be inaccurate. The results that we were hoping for was to have our data closer together because that would mean they all had similar concentrations. We found it interesting that the NPAS-2 primer has primer dimers because in the spring, this was the best primer that I had compared to the other two primers. This is a great example of how, in research, everything could have worked out great in earlier experiments, but there will be points that halt the research. These “bumps in the road” require troubleshooting the problems, choosing new primers, or choosing a new gene overall. We are excited to see what the results of the standard curve for GPR156 will show.