
6 December 2019
By: Nicole Michealson and Marc Nganteh
Introduction:
Referring to our last blog post in the beginning of the semester, we left off performing a PCR cleanup for our TSHb gene and sent it out for sequencing. Unfortunately, we discovered that in order to get an accurate sequence back, the gene being amplified must be over 100 base pairs. This means we had to discontinue our work with this gene and pick a new gene: corticotropin releasing hormone binding protein (CRHBP) gene. CRHBP is used to inactive CRH to regulate hormone levels during pregnancy. Our group picked this gene for two reasons: the first is that we hypothesized it would be expressed more during the breeding season based on researching information about this gene and second, that all three primer sets we designed are over 100 base pairs. We tested our primers and troubleshooted them by using a serial dilution of 0.5 µM concentration and performing a temperature gradient PCR. We then concluded after a PCR cleanup that our primers were working and the correct sequence of our gene (CRHBP) was being amplified.
The last research steps were to finish our quantitative PCR (qPCR) for our CRHBP gene with all the cDNA samples we collected previously, and to do a statistical analysis to see our CRHBP is expressed more in a certain season or sex. A qPCR is different from a regular PCR in the fact it measures DNA amplification at each cycle by using a fluorescent dye called SYBR Green 1 Dye. The fluorescence only becomes measurable after it reaches the threshold point (CT), otherwise known as the crossing point. To determine the amount of cDNA for each unknown sample, there are multiple dilutions of a known amount of standard DNA that generates a standard curve to compare the concentration against the CT. After determining the CT values for each cDNA sample, we plug it into the y for the slope of the standard curve to determine x, which is the mRNA value for each cDNA sample. The mRNA values are then used for the statistical analysis to determine if the samples show any significant difference between season, sex, or season*sex by using a program called SPSS by running an analysis of variance (ANOVA).
Research:
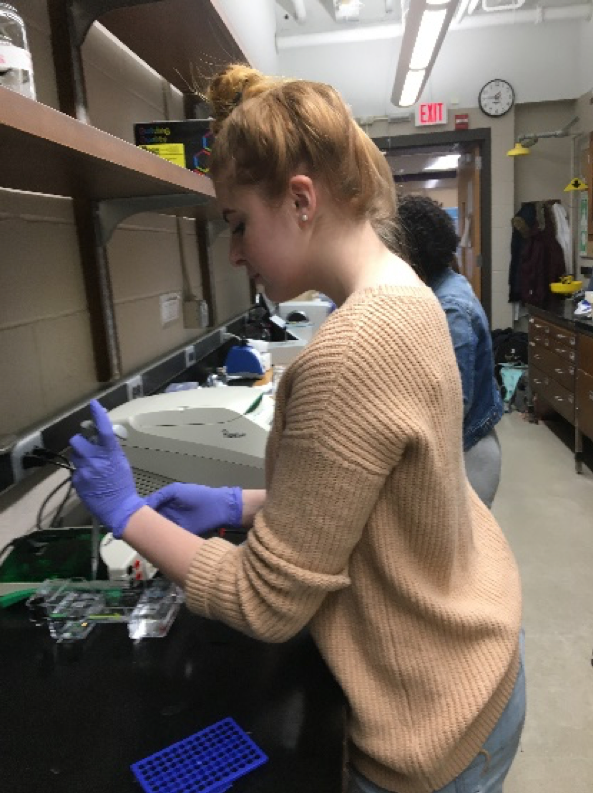
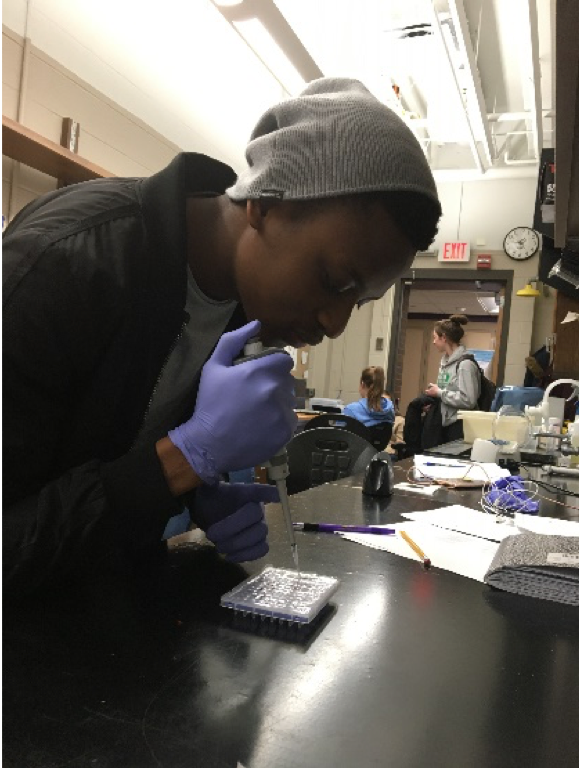
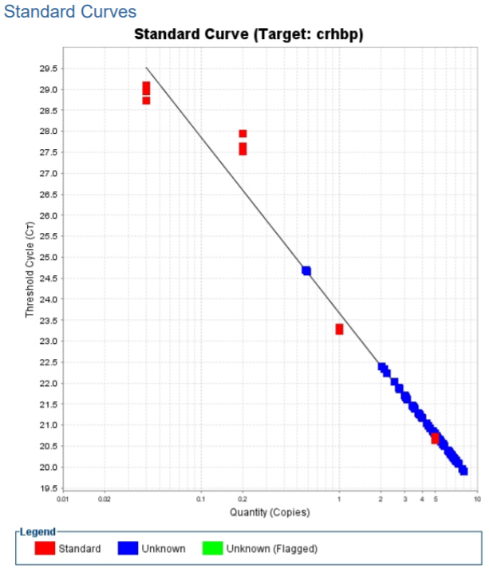
We began the week by running our last qPCR for our CRHBP gene with all the cDNA samples we collected from the lizards. We had 24 cDNA samples, along with the 5 standard dilutions for the standard curve, so we multiplied our reaction by 32 to ensure there was enough samples for each well in the 96 well plate we pipetted in. We also ran the qPCR in triplicates to ensure that there are no errors in our technical process and that the samples for each triplicate should be similar. We used a total of 84 wells in the 96 well plate. After we ran it through the qPCR machine, we got a standard curve and melt curve of our samples that showed success. For the standard curve, we want our standard dilutions and our cDNA sample to fall on the slope and the melt curve should have a single peak with the cDNA samples reaching the threshold point at earlier cycles. For our CRHBP gene, both the melt curve and standard curve fit these qualifications. This is important because it meant that the qPCR is amplifying our gene properly in the cDNA samples.
After we got the results back from the qPCR, we did an analysis to determine the mRNA values (x) based on plugging the CT values we got from the qPCR into y and using the linear equation from our standard curve. Our group also calculated the PCR efficiency, which we found to be 1.7372. A quality PCR efficiency should be between 1.9-2.1, so our value is slightly under that, which means we had some errors during pipetting our samples into the well plate.
Once we calculated the mRNA values, we went into the computer lab and used SPSS statistics to determine if there was a significant difference (p<0.05) between the breeding males and females and non-breeding males and females based on the mRNA values. This program is like excel where we had columns based on; our gene, sex, and season. We discovered that there was no significant difference (p>0.05) between sex, season, or sex*season. This means the CRHBP gene does not regulate changes in reproduction in the green anole lizard, which refutes our hypothesis of CRHBP being more expressed in the breeding season.
We finished off our research on the last week of classes by presenting our scientific posters to faculty members and students. It was a two-hour presentation of explaining the purpose of our research, the methods that went on in our research process, the results we concluded from our methods, and the conclusions we drew based on the results and whether they fit our hypothesis or not. This allowed us to present our findings and gain valuable insights about how to improve our research and more information on how to continue the research if desired. As we discussed our methods and findings with other professors, knowledge was exchanged and ideas on what we could do with our research going forward was handed on to us by experts in the field. This gave us the opportunity to enhance our written and oral communication skills like being able to write an abstract which was a prerequisite for the presentation. An abstract in this case was just a brief summary of the specific ideas and concepts to be presented. We also benefitted from talking to other people who aren’t part of the biology and developed skills of how to interpret our data to the average person on the street. Our abstract and poster were peer-reviewed by our mentors and peers. This was used as a valuable tool for constructive learning and looking at the viewpoints of others. More importantly, this poster presentation gave us the opportunity to engage with members of the Biology department who were also interested in research and having to receive compliments and critiques of our work from people like that can really help us in the future.
Reflection:
If we were going to continue our research, our group would go back to the TSHb gene we worked on previously and insert it into a cloning vector, which can be a plasmid, bacteriophage, etc. The purpose of this is that it extends our DNA sequence in our gene, which would allow us to properly send it out for sequencing to determine if we are amplifying the TSHb gene. After having completed this research we can say without a doubt that the hardest process was performing the qCPR, because ensuring that we didn’t make a mistake in pipetting took a lot of concentration and effort on our part. Along with that, there were lots of different tubes we had to label and organize that took a lot of patience and organization. Presenting at the RISEbio poster conference was frightening in the first few minutes, but the nerves quickly faded away when we got going and had figured out how to address people who either did or did not have a background in biology. Successfully completing our qPCR for the CRHBP gene and presenting our scientific posters left us with a surreal feeling. Beginning the research process, we barely knew how to read pipette volumes. Now by the end of the research, we can say that we have successfully completed our research by concluding that the CRHBP gene does not change in expression levels between seasons or sex after the extensive amount of time we put into this process.
References:
GeneCards®. (N.D.). CRHBP gene. Retrieved from https://www.genecards.org/cgi-bin/carddisp.pl?gene=CRHBP
Millapore Sigma. (2019). Quantitative PCR. Sigma-Aldrich Inc. Retrieved from https://www.sigmaaldrich.com/life-science/molecular-biology/molecular-biology-products.html?TablePage=9620611.